See how things are tracking, is your app growing, how are customers engaging with your app and more!
Understanding How Your Custom App Is Performing
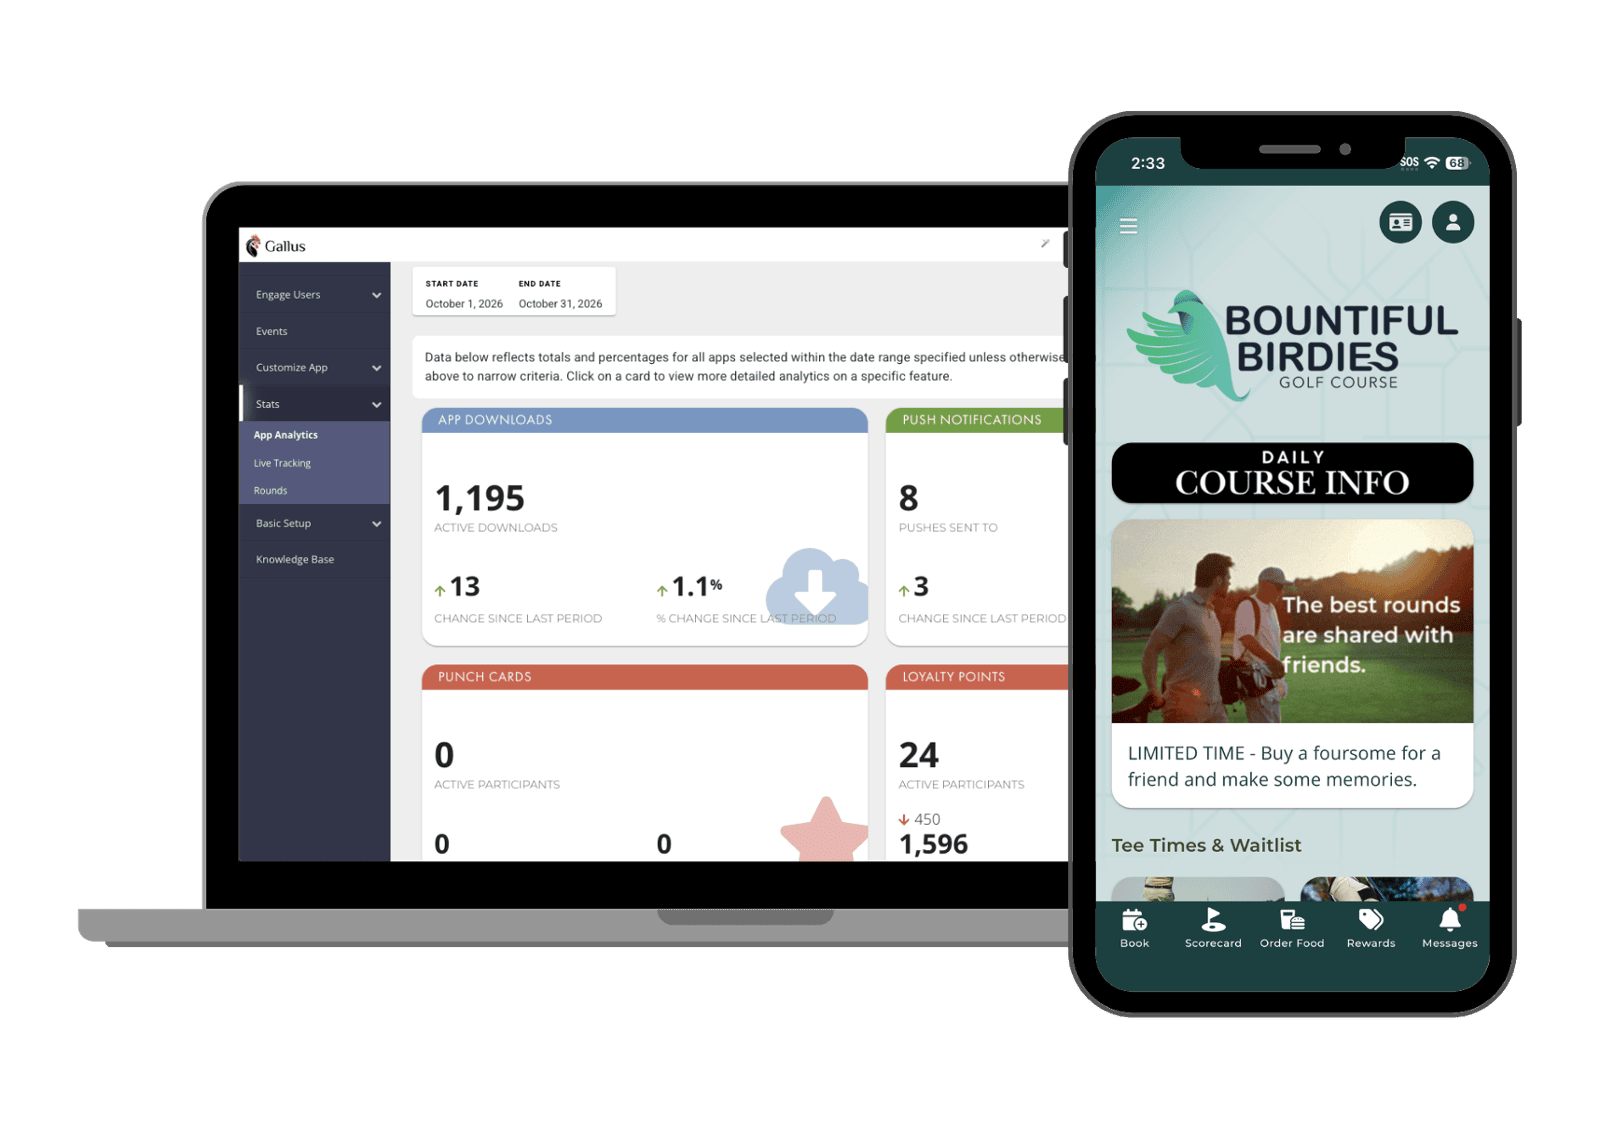
Gallus gives you a custom App Analytics dashboard inside your admin portal. Check your numbers, compare them to previous time periods in a couple of clicks, and export your data to Excel when you want to slice it your own way.
Running more than one course? You can compare performance across all of your apps in one place, using a range of modules and fields to dig into the details.
Compare any time period to a previous one in a couple of clicks, so you can see what’s improving and what might be slipping.
Excel Export
Export your raw data and use Excel or your AI platform of choice to filter, sort, and build the dashboard and reports for your team.
Multi-Course Insights
Operators with multiple courses can see their performance across every golf course app side by side and download the raw data.
App Reporting That Goes at Deep As You Need
The admin dashboard covers your day-to-day reporting, and Gallus also integrates with Google Firebase, which can import into Google Analytics. That lets you go further into customer behavior and trends and customize reports around your course’s goals.
Knowing how golfers use your app helps you plan content and keep it effective all season.
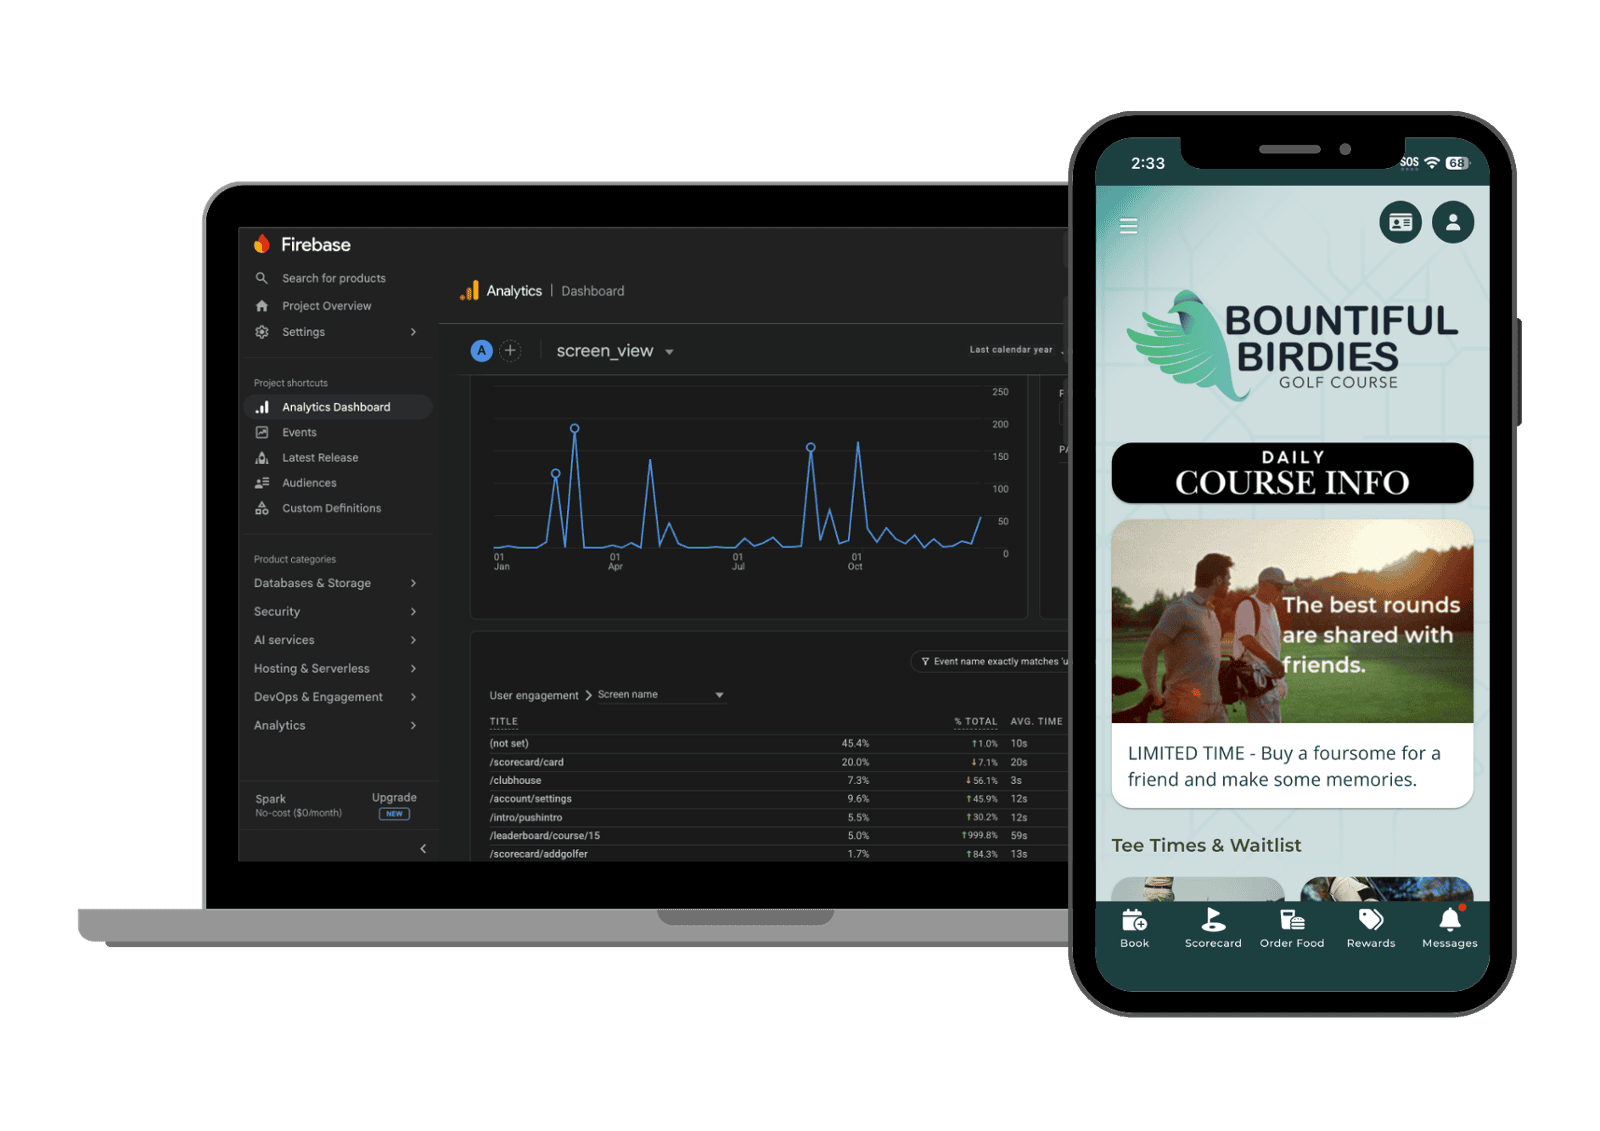
App analytics shows how golfers use your course’s mobile app. With Gallus, you get a custom dashboard in your admin portal for tracking your app’s progress.
Can I compare performance over time?
Yes. You can compare to previous time periods with a couple of clicks.
Can I export my data?
Yes. Export your data to Excel to analyze it however you like.
Does Gallus work with Google Analytics and Firebase?
Yes. Gallus integrates to Firebase which can be connected to GA4, so you can build custom reports around your business’s needs.