As a golf course operator, you have an abundance of data at your disposal from many of the programs you already use. Gallus apps are no different! From Push Notifications to Offer Locker to Loyalty Programs to rounds played to tee time booking revenue, there's a wealth of information that can be used to make better decisions for your business.
But how do you know which metrics to focus on and how to use them to make meaningful changes?
This blog post will serve as an introduction to a series of posts on app data and where specific pieces of information can be accessed. We'll also discuss some of the most important Gallus metrics available to golf course operators and how to use them to make educated decisions.
We began our partnership with Gallus in September of 2018. Since then, our rounds have increased by 5000 and we topped the $1 million mark for the first time in course history this past year.
The digital hands-free loyalty program has been a huge part of our success. Rather than being one and done, repeat business became the norm. Not to mention the communication with our golfers through push notifications and featured news.
We truly believe the Gallus App filled a void in our golf course operation!!
Michael Fernuik
PGA Golf Course Manager, Tierra Del Sol Golf Club
Quick Start Pane
Visible when first logging into an app, this pane provides a quick glance at an app’s audience. It provides realtime data on three metrics:
Total Downloads: The total number of devices that have ever had your app installed.
Active Downloads: The total number of devices that currently have your app installed (a subset of Total Downloads).
Push Opt-In’s: The number of users that currently have your app installed AND have opted into receiving Push Notifications.
The Quick Start Pane is meant to be a snapshot of overall metrics on the day you’ve accessed it, which is why we included it on the first page seen when logging into your dashboard. This is the first level of data to use before graduating to the next level of granularity: the App Analytics Dashboard.
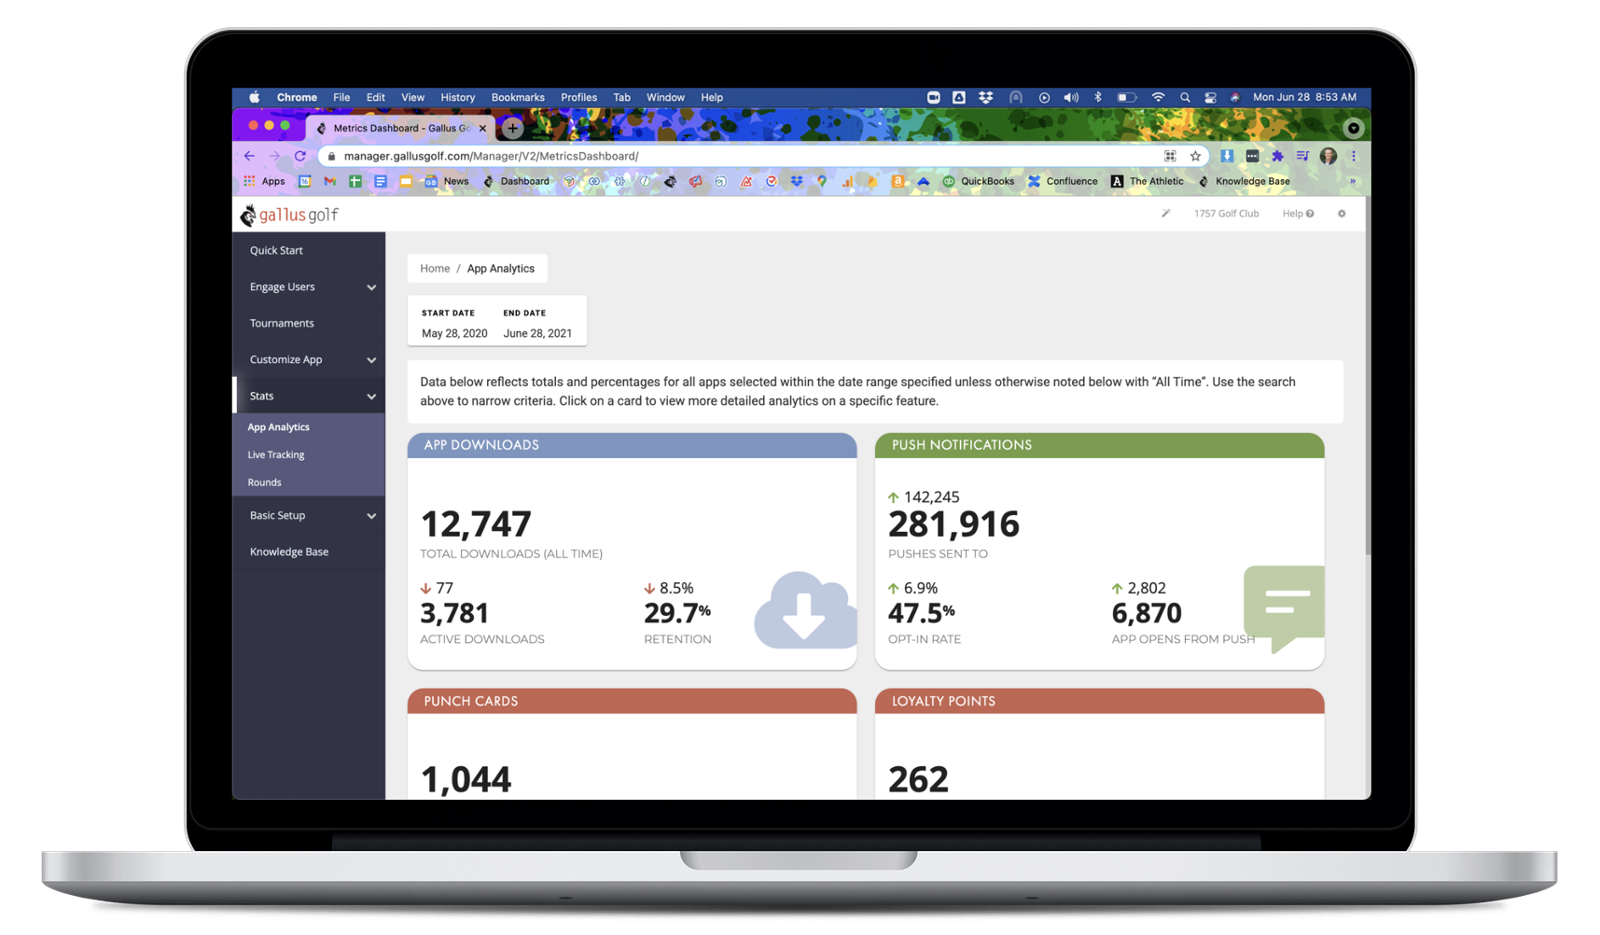
App Analytics Dashboard
Visible via a module within your Gallus Admin Dashboard, App Analytics provides historical data on a number of modules in your app. A date filter allows you to see a specific date range while clicking into a module’s pane provides an approachable report of all available metrics. Add or remove data using the gear icon in the top-right, or export to a CSV to use Excel for data parsing.
Let's walk through the modules available for analysis:
App Downloads
Meant to provide an overview on users and their tendencies, App Downloads provides metrics for different user attributes. Examples include total vs active downloads, uninstalls, % change in downloads from the previous period, and more.
Use this section to gain an understanding of how much your user base has grown or declined. These insights can lead to necessary adjustments for your marketing strategy.
Push Notifications
Push Notifications provides a snapshot into the success of your app's messaging over a given time period. Keep track of your audience with Active Opt-In's, or identify the reach of your messages by analyzing the number of Direct and Influenced Opens.
Loyalty Programs
Keep tabs on the engagement generated from your points or punch card Loyalty Programs by viewing data on the amount of earnings, redemptions, users, and more.
Offer Locker
Offer Locker is an important part of a mobile app's marketing tool kit, allowing app admins to create incentivizes and rewards that are viewed and redeemed through the app. This section of App Analytics provides insight into the performance of these Offers, including views, unique users, and redemptions.
Scorecard
The Scorecard & GPS provides users with an intuitive interface for on-course GPS and scorekeeping. When utilized, app admins gain access to a wealth of insights on their course usage, players per scorecard, and round completion rate.
Check-In
Gallus and Club Prophet's Mobile Check-In module speeds up the check-in process for players while empowering the course to digitize their card charge process using their ProphetPay or Moneris payment processor. This tab of App Analytics provides insight into the number of attempted vs. successful check-ins, revenue, and more.
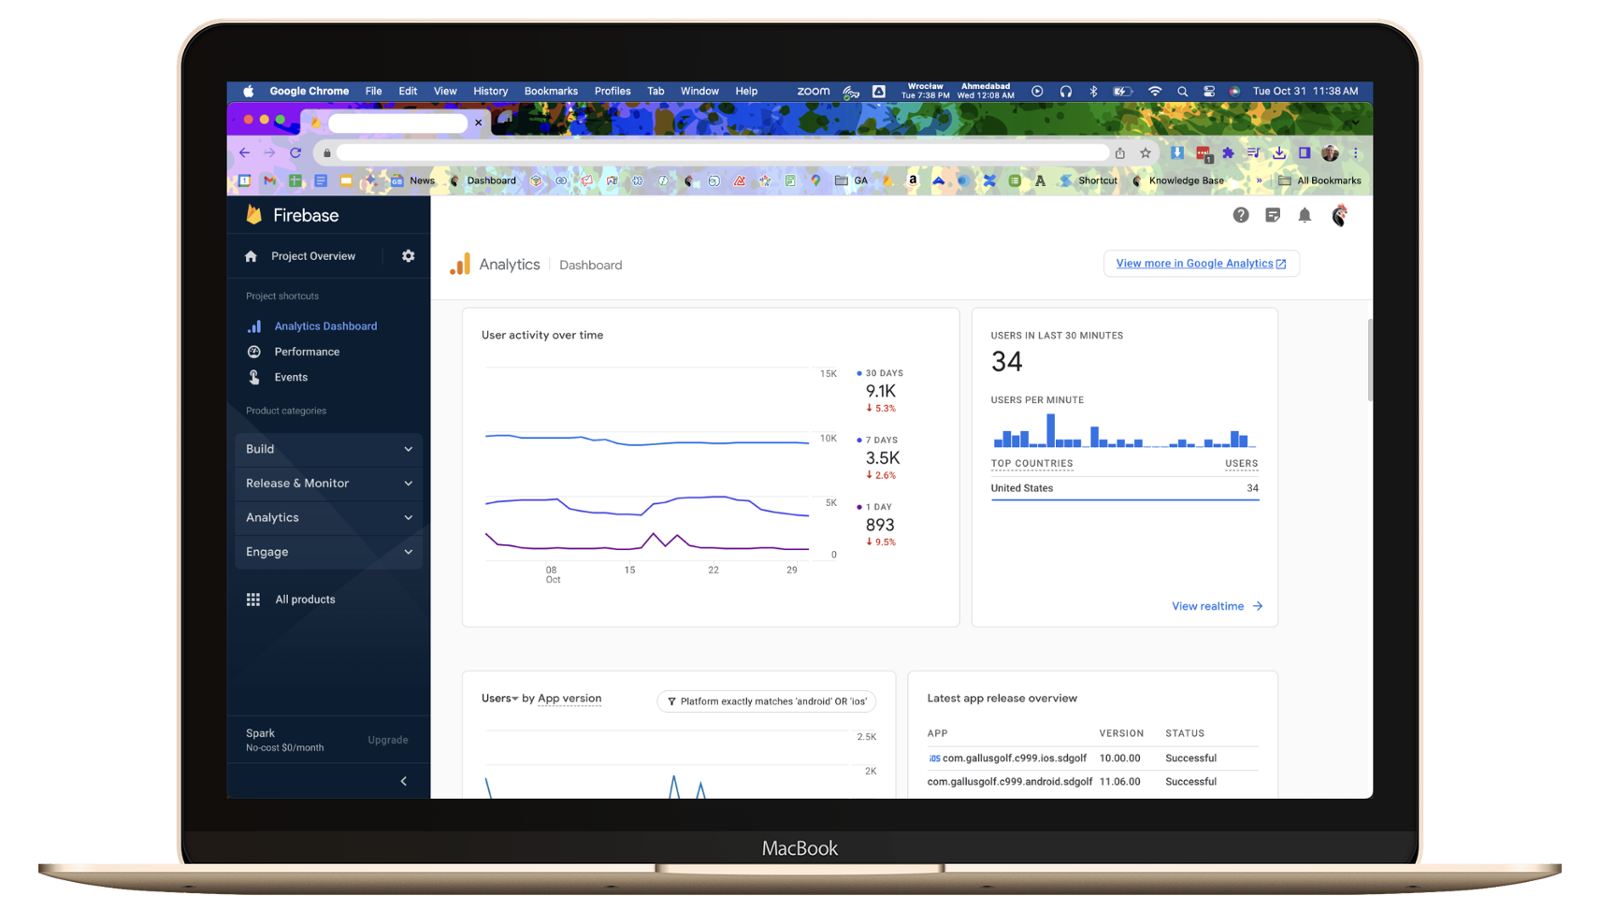
Firebase
Every Gallus app is attached to a Firebase project, which is a platform for building iOS and Android apps. This dashboard includes high-level metrics (searchable by date range) for a better understanding of daily usage.
Let's take a look at some examples of available Firebase metrics:
Users
The number of end users that have opened your app within a given time period. This metric is available in realtime (how many have it open right now) and historical.
Events
Specific actions taken by end users within a given time period.
Examples include:
onboarding_offer_accepted or onboarding_offer_skipped
If your app is utilizing an Onboarding Offer, these metrics help indicate whether the current offer is enticing enough for users to input their personal information consistently.
tee_time_website_opened
Tee Times are the lifeblood of any golf course operation. This metric reflects how many end users opened the Booking Options section of an app.
**Just to note, these are just views (no data on purchases). For revenue data, we recommend working with your booking engine provider to ensure it’s accepting UTM codes, which are already appended to any outbound link from your app to indicate where traffic originated from.
popup_shown
Apps utilizing Pop-Up’s for in-app messaging can access the number of views their messages are receiving, allowing them to understand their total audience for a marketing campaign.
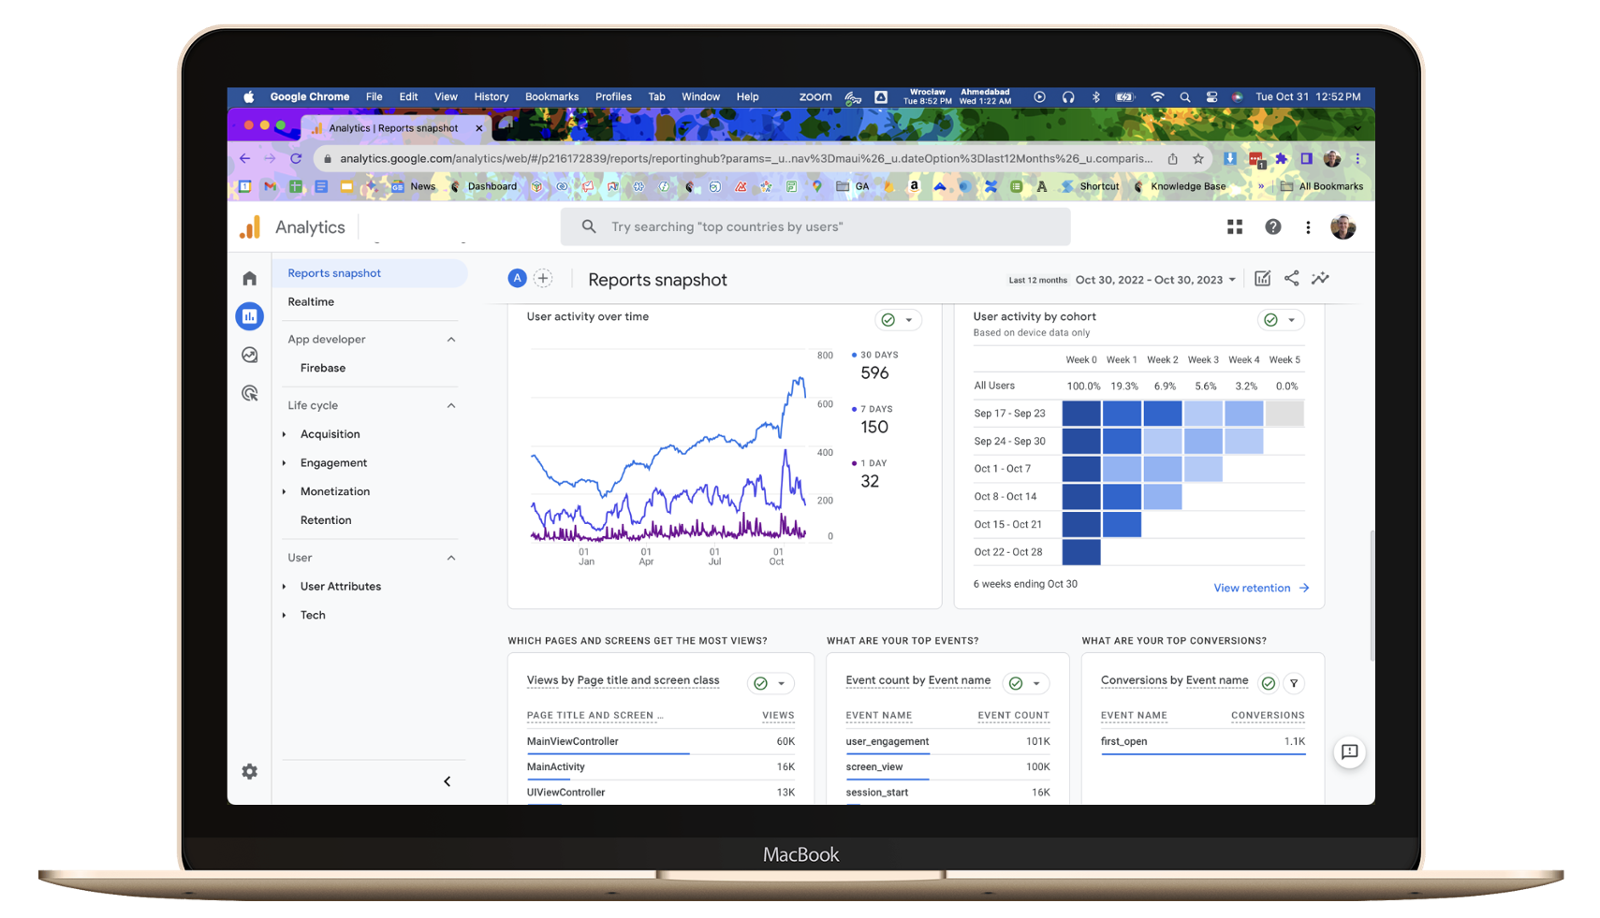
Google Analytics
Google Analytics is an extension of Firebase and provides more precise and granular metrics to Gallus app admins. An account is automatically created when Firebase is set up, meaning you likely have it if you have access to your Firebase account.
In addition to the metrics available within Firebase, Google Analytics allows you to dive deeper into each for even more insights. For instance, Firebase provides overall user metrics (how many total opened your app, etc.) while Google Analytics can provide demographic data like age, gender, and even the cities users are accessing your app from.
You’re also able to build custom reports for metrics that are important to you, like funnel explorations, segment overlaps, and user lifetime analysis.
Conclusion
Each of these platforms provides unique insights into your app’s usage and tendencies, allowing you to make educated decisions on how to create and market content on iOS and Android. Be sure to explore each of these resources to find the analytics flows that work best for your operation.
In the coming weeks, we’ll take a look at some specific examples of modules that can be analyzed for app optimization. Keep an eye out for our next blog post to learn more!